

MOISTURE CONTROL IN HYDROPONIC MAIZE CULTURE IN A SUBSTRATE COMPOSED OF A MIXTURE OF BURNED RICE HUSKS AND COAL SLAG.

|
 
|
By: Felipe Calderón Sáenz et al.
November/99 - April/2000
OBJECTIVES
Verify the operation of a moisture sensor.
INTRODUCTION
An experiment with Hydroponic maize plants was settled the 23 of November/99 with the purpose of verifying the operation of a moisture sensor.
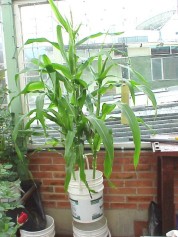
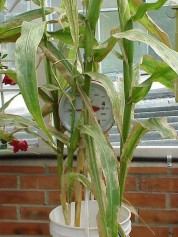
A plastic container 20 lts capacity was taken and filled with 10 lts of dry substrate consistent of a mixture 3:1 by volume of 50 % burned Rice Husks and Coal Slag Ashes. The depth of the substrate was 20 cm. In the center of the container a humidity sensor type MA-10 was horizontally placed to 3 cm of the bottom. The container was hung on a scale of 5 kg of capacity and discounted the weight of the container and the sensor, being the scale in zeros.
Once full the container with 10 lts of dry substrate we took it as the initial weight for the experiment. It weighed 3100 gr. The substrate was soaked with 2 lts nutrient solution of E.C.= 1.80. Ten minutes later it had drained 0,7 lts. The first leaching gave an Electrical Conductivity (E.C.) of 2.40 mmhos/cm. Two additional lts were added and the taking of readings of the weight of the container began. The data of the first day of installed the experiment, although little significant can be seen in the following panel.
|
Fecha |
Hora |
Peso |
Lectura |
Observaciones |
|---|---|---|---|---|
|
Noviembre 23/99 |
18:55:00 |
|
|
Aun no estaba homogeneizada la humedad. |
|
|
19:03:00 |
5100 |
0.64 |
Lixiviado C.E.= 2.65 |
|
|
19:13:00 |
4950 |
0.84 |
|
|
|
19:40:00 |
|
|
Se agregaron 2 lts adicionales |
|
|
19:45:00 |
5350 |
1.75 |
Agua total retenida = 2250 ml. |
|
|
20:00:00 |
4850 |
1.3 |
Lixiviado C.E.= 2.50 |
|
|
20:30:00 |
4850 |
1.55 |
|
From November 24 to November 30 some readings were taken, but neither the weight of the container nor the humidity reading lowered significantly in this period. As of this day and until almost a month later, the values of the readings were relatively erratic. By one hand the very small plants consumed little amount of water and on the other hand it is possible that the intimate contact between the electrode and the substrate only were obtained after a few days under the conditions of field. In the first week of December 15 Maize seeds (Var "Pira") were seeded, in 5 holes, three seeds per hole. Each time the irrigation was named R4 in Nov 29, R5 in Nov 30 and R6 in Dec 14. Since then it was not watered until January 12/2000, date in which we had 5 plants already germinated and of a height of 20 cm and growing vigorously. Only five plants germinated, four plants were of good quality and a fifth of bad quality.
During the first days of the experiment, the relation between the weight of the substrate and the conduction were a little erratic and almost horizontal. There was not observed variations neither the weight nor the conduction. The few variations that appeared were owed to the change of the electrical conductivity of the irrigating solution. This was because the plants in germination process were still very small, and they didn't affect substantially the humidity content of the substrate. Gradually during the first month it was developing a relationship between the value of conduction and the weight of the container. In the following graph we can see the values of conduction during the first month.
From January 12/2000 we take a daily registry of Weight of the container, the electrical conduction of the sensor and the irrigation carried out. Irrigation took place only when the Conduction lowered to 0,50 mA. The water potential (hydric stress) of the plants was observed and it was written down in the observations. Until February 18 the reading was made using a source of 5,0 V D.C., which displayed unstable reading by effects of the polarization of the electrodes. As of February 18 we began to utilize a source of 3,84 V. A.C. This was permanently calibrated by means of an electrode of Conductivity and a solution of KCl of mmhos/cm. With this new source the reading was very stable. During 10 and 12 of March the plants were watered with pure water, because the conductivity of the leached one was a little high. The results of the measurements can be seen in the ANNEXED TABLE No. 1
DISCUSSION
OF RESULTS
BEHAVIOR OF THE CONDUCTION WITH TIME
The behavior of the Conduction with Time followed the typical behavior of "saw's tooth". When the plants were watered, the reading raised steeply and soon it was descending as the plants absorbed the moisture of the substrate to return to ascend each time a new irrigation took place. Not very often withering signs were observed in the plants. In Feb. 14 signs of withering were observed, with a reading of 0,11 mA, towards the 12:45 p.m. with elevated solar brightness and high temperature in the greenhouse. Other days as in February 7 to 19:00 with readings of 0,09 mA signs of withering were not observed. It is necessary to consider the hour of this reading, since by this time there was no irradiation and the temperature was but moderate that towards the 12 A.M. In February 29 appeared dehydration signs towards the 1:10 p.m. with a reading of 0,19 mA.
RELATIONSHIP BETWEEN VALUES OF CONDUCTION AND NECESSITY OF IRRIGATION
The values under which the irrigation took place can be seen in the data table (Annex No. 1). Always the plants were irrigated when the reading of Conduction was less than 0,50 mA, in some cases as low as 0,09 mA (Feb. 7) and 0,11 mA (Feb 12 and Feb 14). Once watered the plants and before taking the following reading it was waited at least one hour until complete homogenization of the moisture in the substrate and drainage of the excess of water. The registered values of conduction after the irrigation were, as it was expected, very high. These values were descending in the course of the following days, until arriving low values indicative of rrigation necessity. In general the plants were watered when the value of the conduction was less than 0,31 mA.
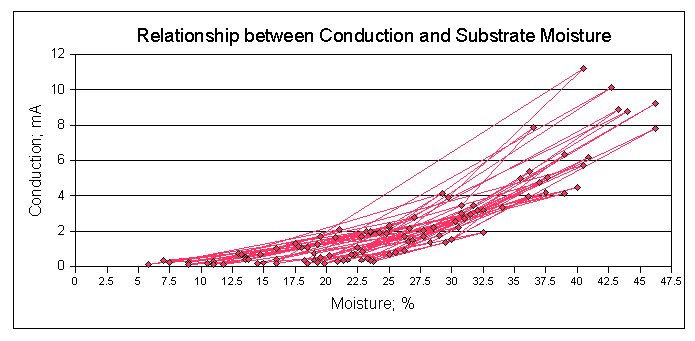
RELATIONSHIP BETWEEN THE VALUES OF CURRENT AND THE WEIGHT OF THE SUBSTRATE

As
it can be seen in this graph, the relationship between the percentage of moisture
in the substrate and the measurement of conduction was almost completely linear
and of high degree of correlation all the time that lasted the experiment. The
red line represents the relationship between the conduction and the increase
in weight of the substrate plus the Plant. As can be seen, the line goes up
and down in inclined form, following a defined pattern whose mean slope represents
the relationship between Conduction and Moisture. As the experiment developed,
the line was displaced towards the right due to the increase in weight of the
plant-substrate assembly by the growth of the plant. Also as the roots colonized
profusely the substrate they caused an increase in the moisture retention which
in turn caused higher readings of conduction immediately after the watering
took place.
See photos of this experiment in discs: Disk 59 Photo 15; Disk 75; Disk 76;
TABLE
No. 1 Complete series of data on request at acaldero@cable.net.co